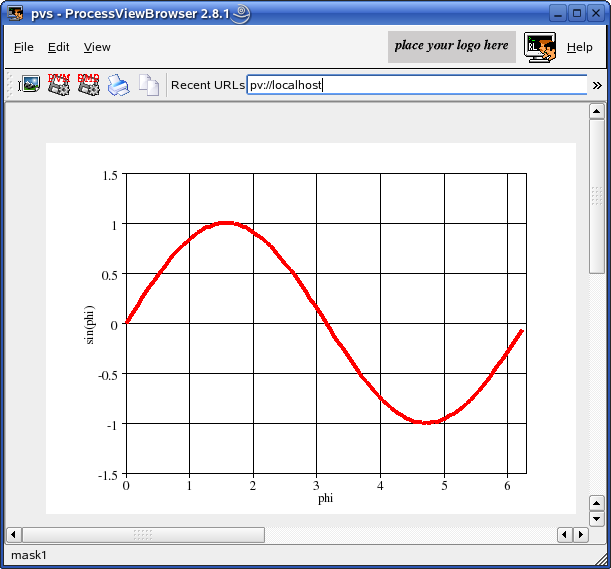
Dies ist ein Beispiel einer xy-Grafik. Geben Sie ein Custom Widget "QDraw" ein und kopieren den folgenden Code. Sie können beliebig viele Linien ausgeben.
#include <math.h>

typedef struct // (todo: define your data structure here)
{
  float x[100];
  float y[100];
  int   n;
}
DATA;

static int drawGraphic(PARAM *p, int id, DATA *d)
{
int x,y,w,h,fontsize;

  x = 80;
  y = 30;
  w = 400;
  h = 300;
  fontsize = 10;

  gBeginDraw  (p,id);
  gSetColor   (p,BLACK);
  gSetFont    (p,TIMES,fontsize,Normal,0);
  gBoxWithText(p,x,y,w,h,fontsize,"phi","sin(phi)",NULL);
  gXAxis      (p,0,1.0f,2.0f*3.141592654f,1);
  gYAxis      (p,-1.5f,0.5f,1.5f,1);
  gXGrid      (p);
  gYGrid      (p);
  gSetColor   (p,RED);
  gSetWidth   (p,4);
  gLine       (p,d->x,d->y,d->n);
  gEndDraw    (p);
  return 0;
}

static int slotInit(PARAM *p, DATA *d)
{
  if(p == NULL || d == NULL) return -1;
  memset(d,0,sizeof(DATA));
  int i;
  float xval;

  for(i=0; i<100; i++) // for testing purposes we set a sinus curve
  {
    xval = (((float) i) * 2.0f * 3.141592654f) / 100.0f;
    d->x[i] = xval;
    d->y[i] = (float) sin(xval);
  }
  d->n = 100;

  return 0;
}

static int slotButtonEvent(PARAM *p, int id, DATA *d)
{
  if(p == NULL || id == 0 || d == NULL) return -1;
  if(id == pushButtonDraw)
  {
    drawGraphic(p, draw1, d);
  }
  return 0;
}
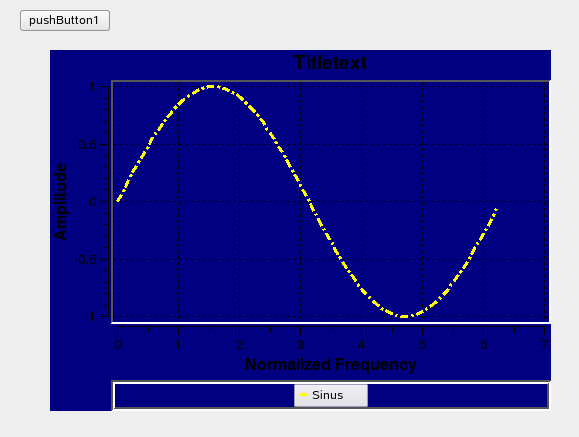
Geben Sie ein QWT Plot ein. Stellen Sie sicher, dass "nCurves" und "nMarker" auf das Maximum der gewünschten Linien eingestellt ist. Der Code, um das grundlegende QWT Plot zu definieren, wird generiert. Den Rest müssen Sie programmieren (siehe "slotInit()"). Der Wertebereich der Achsen wird automatisch bestimmt. Um eine Linie auszugeben, sehen Sie sich den Code in "slotNullEvent()" an.
Beispiel zu qwt Plot. Bitte kopieren Sie von dem folgenden Beispiel in Ihre Anwendung.
typedef struct // (todo: define your data structure here)
{
  double xa[100];
  double ya[100];
}
DATA;

static int slotInit(PARAM *p, DATA *d)
{
  // outline
  qpwEnableOutline(p,qwtPlot1,1);
  qpwSetOutlinePen(p,qwtPlot1,GREEN);

  // legend
  qpwSetAutoLegend(p,qwtPlot1,1);
  qpwEnableLegend(p,qwtPlot1,1);
  qpwSetLegendPos(p,qwtPlot1,0);
  qpwSetLegendFrameStyle(p,qwtPlot1,Box|Sunken);

  // axes
  qpwSetAxisTitle(p,qwtPlot1,xBottom, "Normalized Frequency");
  qpwSetAxisTitle(p,qwtPlot1,yLeft, "Amplitude");

  // curves
  qpwInsertCurve(p,qwtPlot1,0,"Sinus");
  qpwSetCurvePen(p,qwtPlot1,0,YELLOW,3,DashDotLine);
  qpwSetCurveYAxis(p,qwtPlot1,0,yLeft);

  for(int i=0; i<100; i++) // here we set a sinus curve
  {
    d->xa[i] = (((double) i) * 2.0 * 3.141592654) / 100.0;
    d->ya[i] = sin(d->xa[i]);
  }

  return 0;
}

static int slotNullEvent(PARAM *p, DATA *d)
{
  if(p == NULL || d == NULL) return -1;
  qpwSetCurveData(p,qwtPlot1,0,100,d->xa,d->ya);
  //qpwSetCurveSymbol(p,qwtPlot1,0,MarkerDiamond,RED,BLUE,10,10);
  qpwReplot(p,qwtPlot1);
  //qpwRemoveCurve(p,wtPlot1,0);
  return 0;
}