Integration of libcairo in pvbrowser
Backward
Content
Forward
Measurements with SVG Graphics
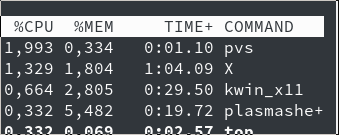 This snapshot shows the CPU load when a pvserver (process pvs) in an infinite loop draws the graph as SVG once per second.
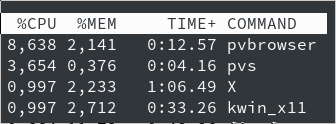 This snapshot shows the CPU usage when a pvbrowser client is added to the display. The pvserver uses little CPU compared with the client
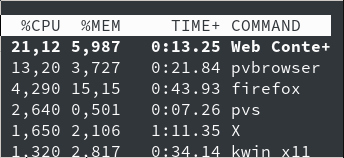 This snapshot shows the CPU usage when a firefox client is added. Firefox displays the SVG correctly. It looks as Firefox renders the graphic with less CPU load than pvbrowser with the underlying QSvgRenderer but the process "Web Content" also belongs to Firefox.
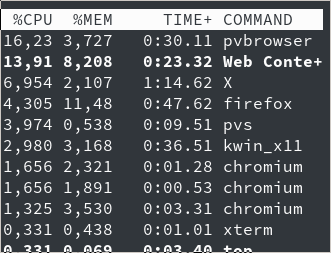 This snapshot shows the CPU usage when a chromium client is added. Chromium only represents the ALT text of the SVG. You can right-click on it and you will see the SVG graphic. See also the note below.
One can see from the measurements that the CPU load of the pvserver with 3 simultaneous clients is twice as high with PNG graphics as with SVG. However, SVG has a much larger file size in the example, which has to be invoiced for a communication between client and server.
Backward
Content
Forward