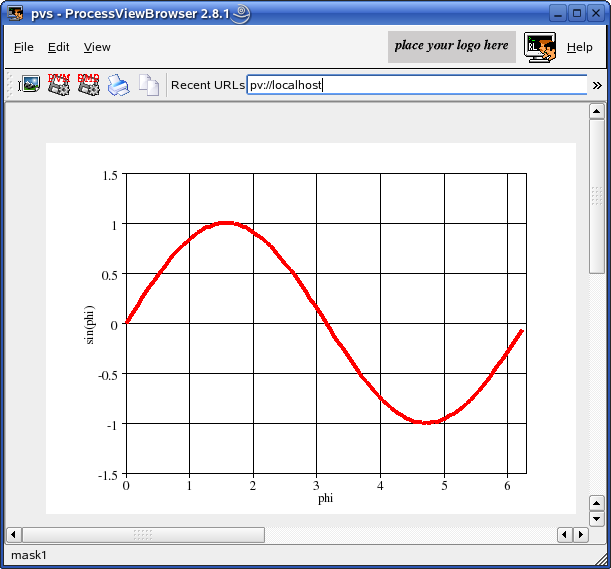
This is an example for an xy-graph. Input a custom widget "QDraw" and copy the following code. You can output as many lines as you want.
#include <math.h>

typedef struct // (todo: define your data structure here)
{
  float x[100];
  float y[100];
  int   n;
}
DATA;

static int drawGraphic(PARAM *p, int id, DATA *d)
{
int x,y,w,h,fontsize;

  x = 80;
  y = 30;
  w = 400;
  h = 300;
  fontsize = 10;

  gBeginDraw  (p,id);
  gSetColor   (p,BLACK);
  gSetFont    (p,TIMES,fontsize,Normal,0);
  gBoxWithText(p,x,y,w,h,fontsize,"phi","sin(phi)",NULL);
  gXAxis      (p,0,1.0f,2.0f*3.141592654f,1);
  gYAxis      (p,-1.5f,0.5f,1.5f,1);
  gXGrid      (p);
  gYGrid      (p);
  gSetColor   (p,RED);
  gSetWidth   (p,4);
  gLine       (p,d->x,d->y,d->n);
  gEndDraw    (p);
  return 0;
}

static int slotInit(PARAM *p, DATA *d)
{
  if(p == NULL || d == NULL) return -1;
  memset(d,0,sizeof(DATA));
  int i;
  float xval;

  for(i=0; i<100; i++) // for testing purposes we set a sinus curve
  {
    xval = (((float) i) * 2.0f * 3.141592654f) / 100.0f;
    d->x[i] = xval;
    d->y[i] = (float) sin(xval);
  }
  d->n = 100;

  return 0;
}

static int slotButtonEvent(PARAM *p, int id, DATA *d)
{
  if(p == NULL || id == 0 || d == NULL) return -1;
  if(id == pushButtonDraw)
  {
    drawGraphic(p, draw1, d);
  }
  return 0;
}
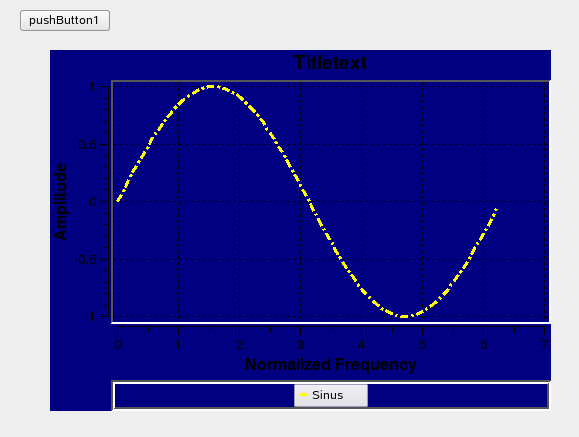
Input a QWT Plot. Be sure to set "nCurves" and "nMarker" to the maximum value you want to use. The code needed to define the basic QWT Plot will be generated. The rest must be programmed see "slotInit()". The Range of values in the axis will be determined automatically. In order to output a curve see slotNullEvent(). example of qwt plot Please copy and paste from the following example.
typedef struct // (todo: define your data structure here)
{
  double xa[100];
  double ya[100];
}
DATA;

static int slotInit(PARAM *p, DATA *d)
{
  // outline
  qpwEnableOutline(p,qwtPlot1,1);
  qpwSetOutlinePen(p,qwtPlot1,GREEN);

  // legend
  qpwSetAutoLegend(p,qwtPlot1,1);
  qpwEnableLegend(p,qwtPlot1,1);
  qpwSetLegendPos(p,qwtPlot1,0);
  qpwSetLegendFrameStyle(p,qwtPlot1,Box|Sunken);

  // axes
  qpwSetAxisTitle(p,qwtPlot1,xBottom, "Normalized Frequency");
  qpwSetAxisTitle(p,qwtPlot1,yLeft, "Amplitude");

  // curves
  qpwInsertCurve(p,qwtPlot1,0,"Sinus");
  qpwSetCurvePen(p,qwtPlot1,0,YELLOW,3,DashDotLine);
  qpwSetCurveYAxis(p,qwtPlot1,0,yLeft);

  for(int i=0; i<100; i++) // here we set a sinus curve
  {
    d->xa[i] = (((double) i) * 2.0 * 3.141592654) / 100.0;
    d->ya[i] = sin(d->xa[i]);
  }

  return 0;
}

static int slotNullEvent(PARAM *p, DATA *d)
{
  if(p == NULL || d == NULL) return -1;
  qpwSetCurveData(p,qwtPlot1,0,100,d->xa,d->ya);
  //qpwSetCurveSymbol(p,qwtPlot1,0,MarkerDiamond,RED,BLUE,10,10);
  qpwReplot(p,qwtPlot1);
  //qpwRemoveCurve(p,wtPlot1,0);
  return 0;
}