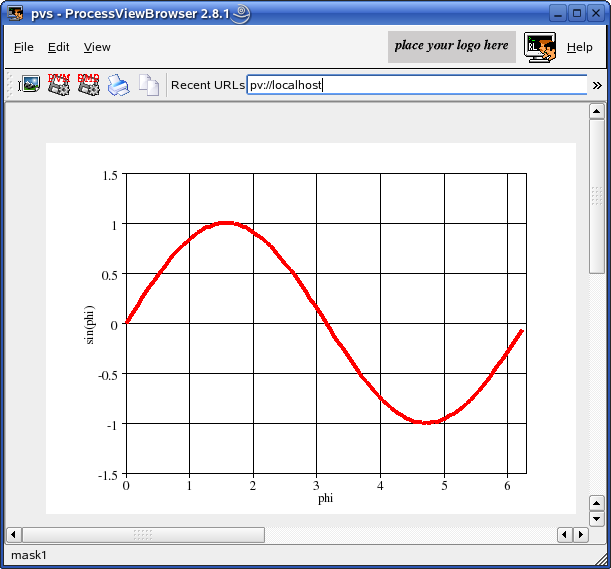
Това е пример за xy-графика. Вкарайте нестандартния визуален обект "QDraw" в Qt designer и копирайте следния код. Може да визуализирате толкова линии, колкото желаете.
#include <math.h>

typedef struct // (todo: define your data structure here)
{
  float x[100];
  float y[100];
  int   n;
}
DATA;

static int drawGraphic(PARAM *p, int id, DATA *d)
{
int x,y,w,h,fontsize;

  x = 80;
  y = 30;
  w = 400;
  h = 300;
  fontsize = 10;

  gBeginDraw  (p,id);
  gSetColor   (p,BLACK);
  gSetFont    (p,TIMES,fontsize,Normal,0);
  gBoxWithText(p,x,y,w,h,fontsize,"phi","sin(phi)",NULL);
  gXAxis      (p,0,1.0f,2.0f*3.141592654f,1);
  gYAxis      (p,-1.5f,0.5f,1.5f,1);
  gXGrid      (p);
  gYGrid      (p);
  gSetColor   (p,RED);
  gSetWidth   (p,4);
  gLine       (p,d->x,d->y,d->n);
  gEndDraw    (p);
  return 0;
}

static int slotInit(PARAM *p, DATA *d)
{
  if(p == NULL || d == NULL) return -1;
  memset(d,0,sizeof(DATA));
  int i;
  float xval;

  for(i=0; i<100; i++) // for testing purposes we set a sinus curve
  {
    xval = (((float) i) * 2.0f * 3.141592654f) / 100.0f;
    d->x[i] = xval;
    d->y[i] = (float) sin(xval);
  }
  d->n = 100;

  return 0;
}

static int slotButtonEvent(PARAM *p, int id, DATA *d)
{
  if(p == NULL || id == 0 || d == NULL) return -1;
  if(id == pushButtonDraw)
  {
    drawGraphic(p, draw1, d);
  }
  return 0;
}
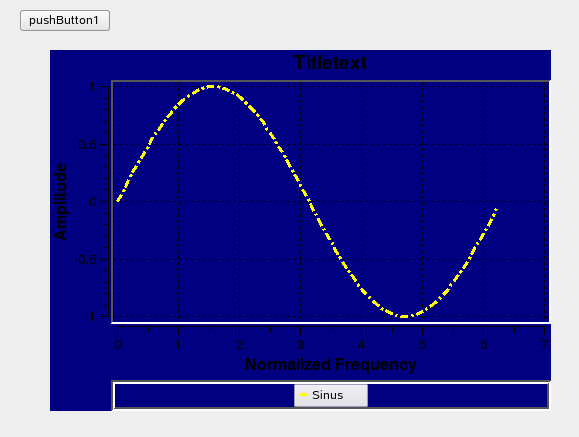
Вкарайте QWT Plot в Qt designer и настройте "nCurves" и "nMarker" на максималните стойности които искате да използвате. Кода, необходим за създаването на обикновен QWT Plot, ще бъде генериран. Останалото трябва да бъде програмирано - прегледайте "slotInit()". Обхвата на стойностите по осите, ще се определи автоматично. За да визуализирате крива вижте slotNullEvent().
пример за qwt plot Моля копирайте кода от следния пример.
typedef struct // (todo: define your data structure here)
{
  double xa[100];
  double ya[100];
}
DATA;

static int slotInit(PARAM *p, DATA *d)
{
  // outline
  qpwEnableOutline(p,qwtPlot1,1);
  qpwSetOutlinePen(p,qwtPlot1,GREEN);

  // legend
  qpwSetAutoLegend(p,qwtPlot1,1);
  qpwEnableLegend(p,qwtPlot1,1);
  qpwSetLegendPos(p,qwtPlot1,0);
  qpwSetLegendFrameStyle(p,qwtPlot1,Box|Sunken);

  // axes
  qpwSetAxisTitle(p,qwtPlot1,xBottom, "Normalized Frequency");
  qpwSetAxisTitle(p,qwtPlot1,yLeft, "Amplitude");

  // curves
  qpwInsertCurve(p,qwtPlot1,0,"Sinus");
  qpwSetCurvePen(p,qwtPlot1,0,YELLOW,3,DashDotLine);
  qpwSetCurveYAxis(p,qwtPlot1,0,yLeft);

  for(int i=0; i<100; i++) // here we set a sinus curve
  {
    d->xa[i] = (((double) i) * 2.0 * 3.141592654) / 100.0;
    d->ya[i] = sin(d->xa[i]);
  }

  return 0;
}

static int slotNullEvent(PARAM *p, DATA *d)
{
  if(p == NULL || d == NULL) return -1;
  qpwSetCurveData(p,qwtPlot1,0,100,d->xa,d->ya);
  //qpwSetCurveSymbol(p,qwtPlot1,0,MarkerDiamond,RED,BLUE,10,10);
  qpwReplot(p,qwtPlot1);
  //qpwRemoveCurve(p,wtPlot1,0);
  return 0;
}