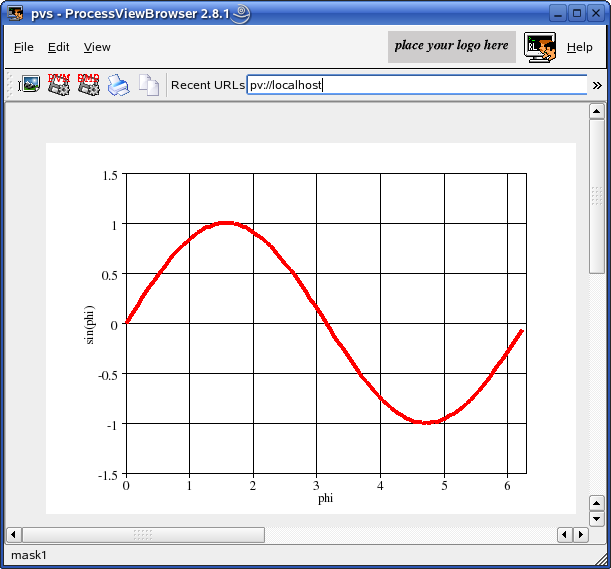
Este es un ejemplo de un grafico-xy. Ingresa un widget de usuario "QDraw" en Qt designer y copia el siguiente trozo de código. Puedes graficar tantas curvas como sea necesario.
#include <math.h>

typedef struct // (todo: define your data structure here)
{
  float x[100];
  float y[100];
  int   n;
}
DATA;

static int drawGraphic(PARAM *p, int id, DATA *d)
{
int x,y,w,h,fontsize;

  x = 80;
  y = 30;
  w = 400;
  h = 300;
  fontsize = 10;

  gBeginDraw  (p,id);
  gSetColor   (p,BLACK);
  gSetFont    (p,TIMES,fontsize,Normal,0);
  gBoxWithText(p,x,y,w,h,fontsize,"phi","sin(phi)",NULL);
  gXAxis      (p,0,1.0f,2.0f*3.141592654f,1);
  gYAxis      (p,-1.5f,0.5f,1.5f,1);
  gXGrid      (p);
  gYGrid      (p);
  gSetColor   (p,RED);
  gSetWidth   (p,4);
  gLine       (p,d->x,d->y,d->n);
  gEndDraw    (p);
  return 0;
}

static int slotInit(PARAM *p, DATA *d)
{
  if(p == NULL || d == NULL) return -1;
  memset(d,0,sizeof(DATA));
  int i;
  float xval;

  for(i=0; i<100; i++) // for testing purposes we set a sinus curve
  {
    xval = (((float) i) * 2.0f * 3.141592654f) / 100.0f;
    d->x[i] = xval;
    d->y[i] = (float) sin(xval);
  }
  d->n = 100;

  return 0;
}

static int slotButtonEvent(PARAM *p, int id, DATA *d)
{
  if(p == NULL || id == 0 || d == NULL) return -1;
  if(id == pushButtonDraw)
  {
    drawGraphic(p, draw1, d);
  }
  return 0;
}
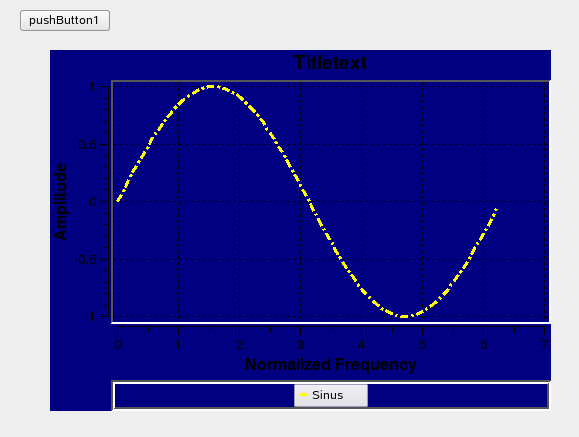
En Qt designer ingresa un QWT Plot. Asegúrate de configurar "nCurves" y "nMarker" en el máximo valor que desees usar. El código para definir un QWT Plot básico será generado automáticamente. El resto debes programarlo (ver "slotInit()"). El rango de valores en los ejes será determinado automáticamente. Revisa slotNullEvent() para desplegar el gráfico. Copia y pega este trozo de código como ejemplo de uso de qwt plot.
typedef struct // (todo: define your data structure here)
{
  double xa[100];
  double ya[100];
}
DATA;

static int slotInit(PARAM *p, DATA *d)
{
  // outline
  qpwEnableOutline(p,qwtPlot1,1);
  qpwSetOutlinePen(p,qwtPlot1,GREEN);

  // legend
  qpwSetAutoLegend(p,qwtPlot1,1);
  qpwEnableLegend(p,qwtPlot1,1);
  qpwSetLegendPos(p,qwtPlot1,0);
  qpwSetLegendFrameStyle(p,qwtPlot1,Box|Sunken);

  // axes
  qpwSetAxisTitle(p,qwtPlot1,xBottom, "Normalized Frequency");
  qpwSetAxisTitle(p,qwtPlot1,yLeft, "Amplitude");

  // curves
  qpwInsertCurve(p,qwtPlot1,0,"Sinus");
  qpwSetCurvePen(p,qwtPlot1,0,YELLOW,3,DashDotLine);
  qpwSetCurveYAxis(p,qwtPlot1,0,yLeft);

  for(int i=0; i<100; i++) // here we set a sinus curve
  {
    d->xa[i] = (((double) i) * 2.0 * 3.141592654) / 100.0;
    d->ya[i] = sin(d->xa[i]);
  }

  return 0;
}

static int slotNullEvent(PARAM *p, DATA *d)
{
  if(p == NULL || d == NULL) return -1;
  qpwSetCurveData(p,qwtPlot1,0,100,d->xa,d->ya);
  //qpwSetCurveSymbol(p,qwtPlot1,0,MarkerDiamond,RED,BLUE,10,10);
  qpwReplot(p,qwtPlot1);
  //qpwRemoveCurve(p,wtPlot1,0);
  return 0;
}